Pasture Biomass
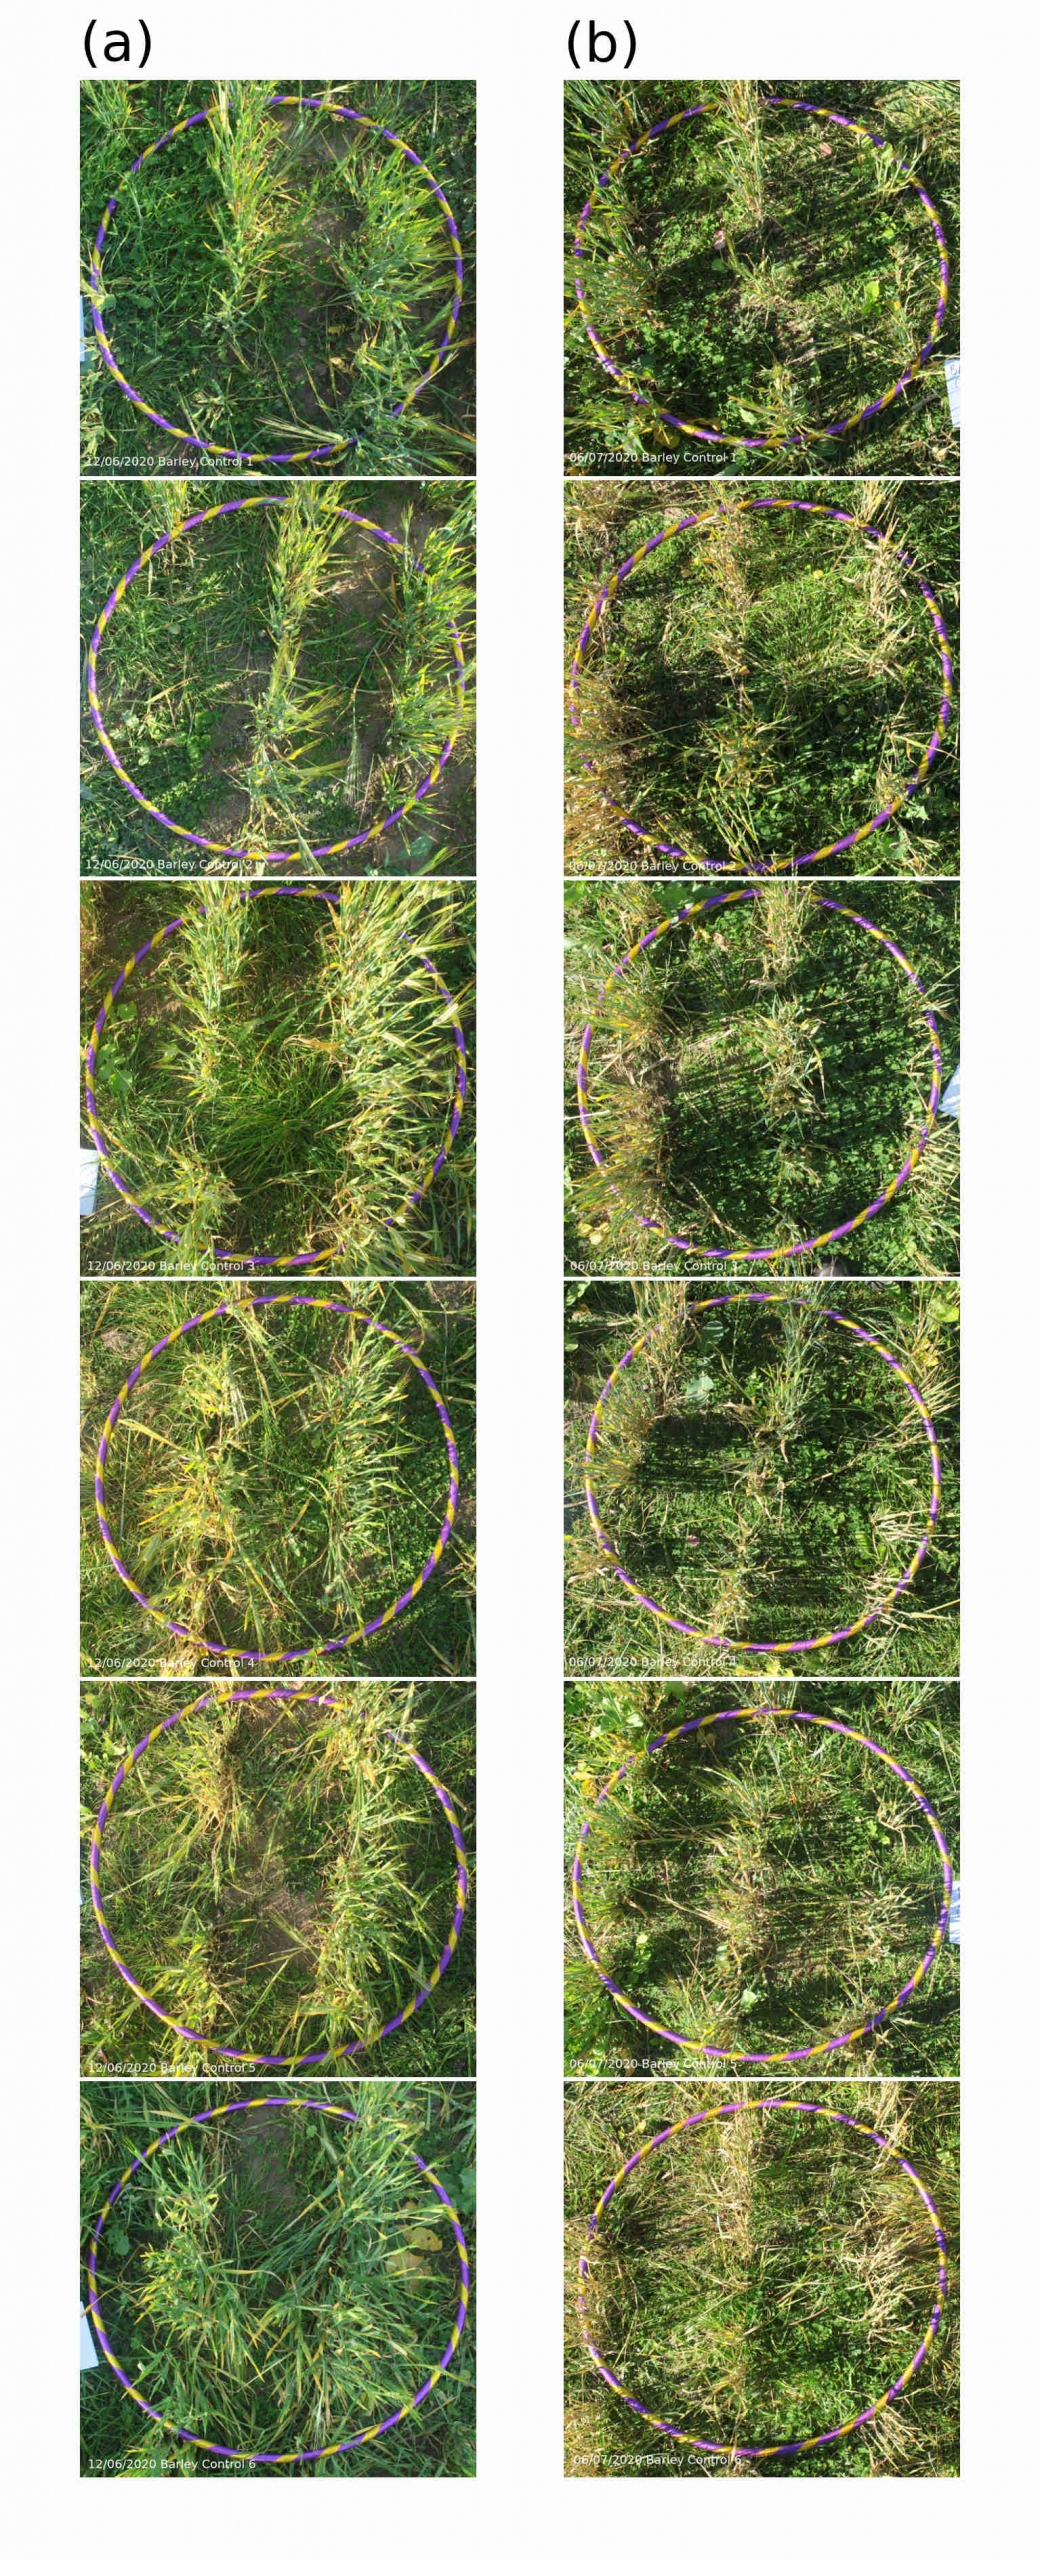
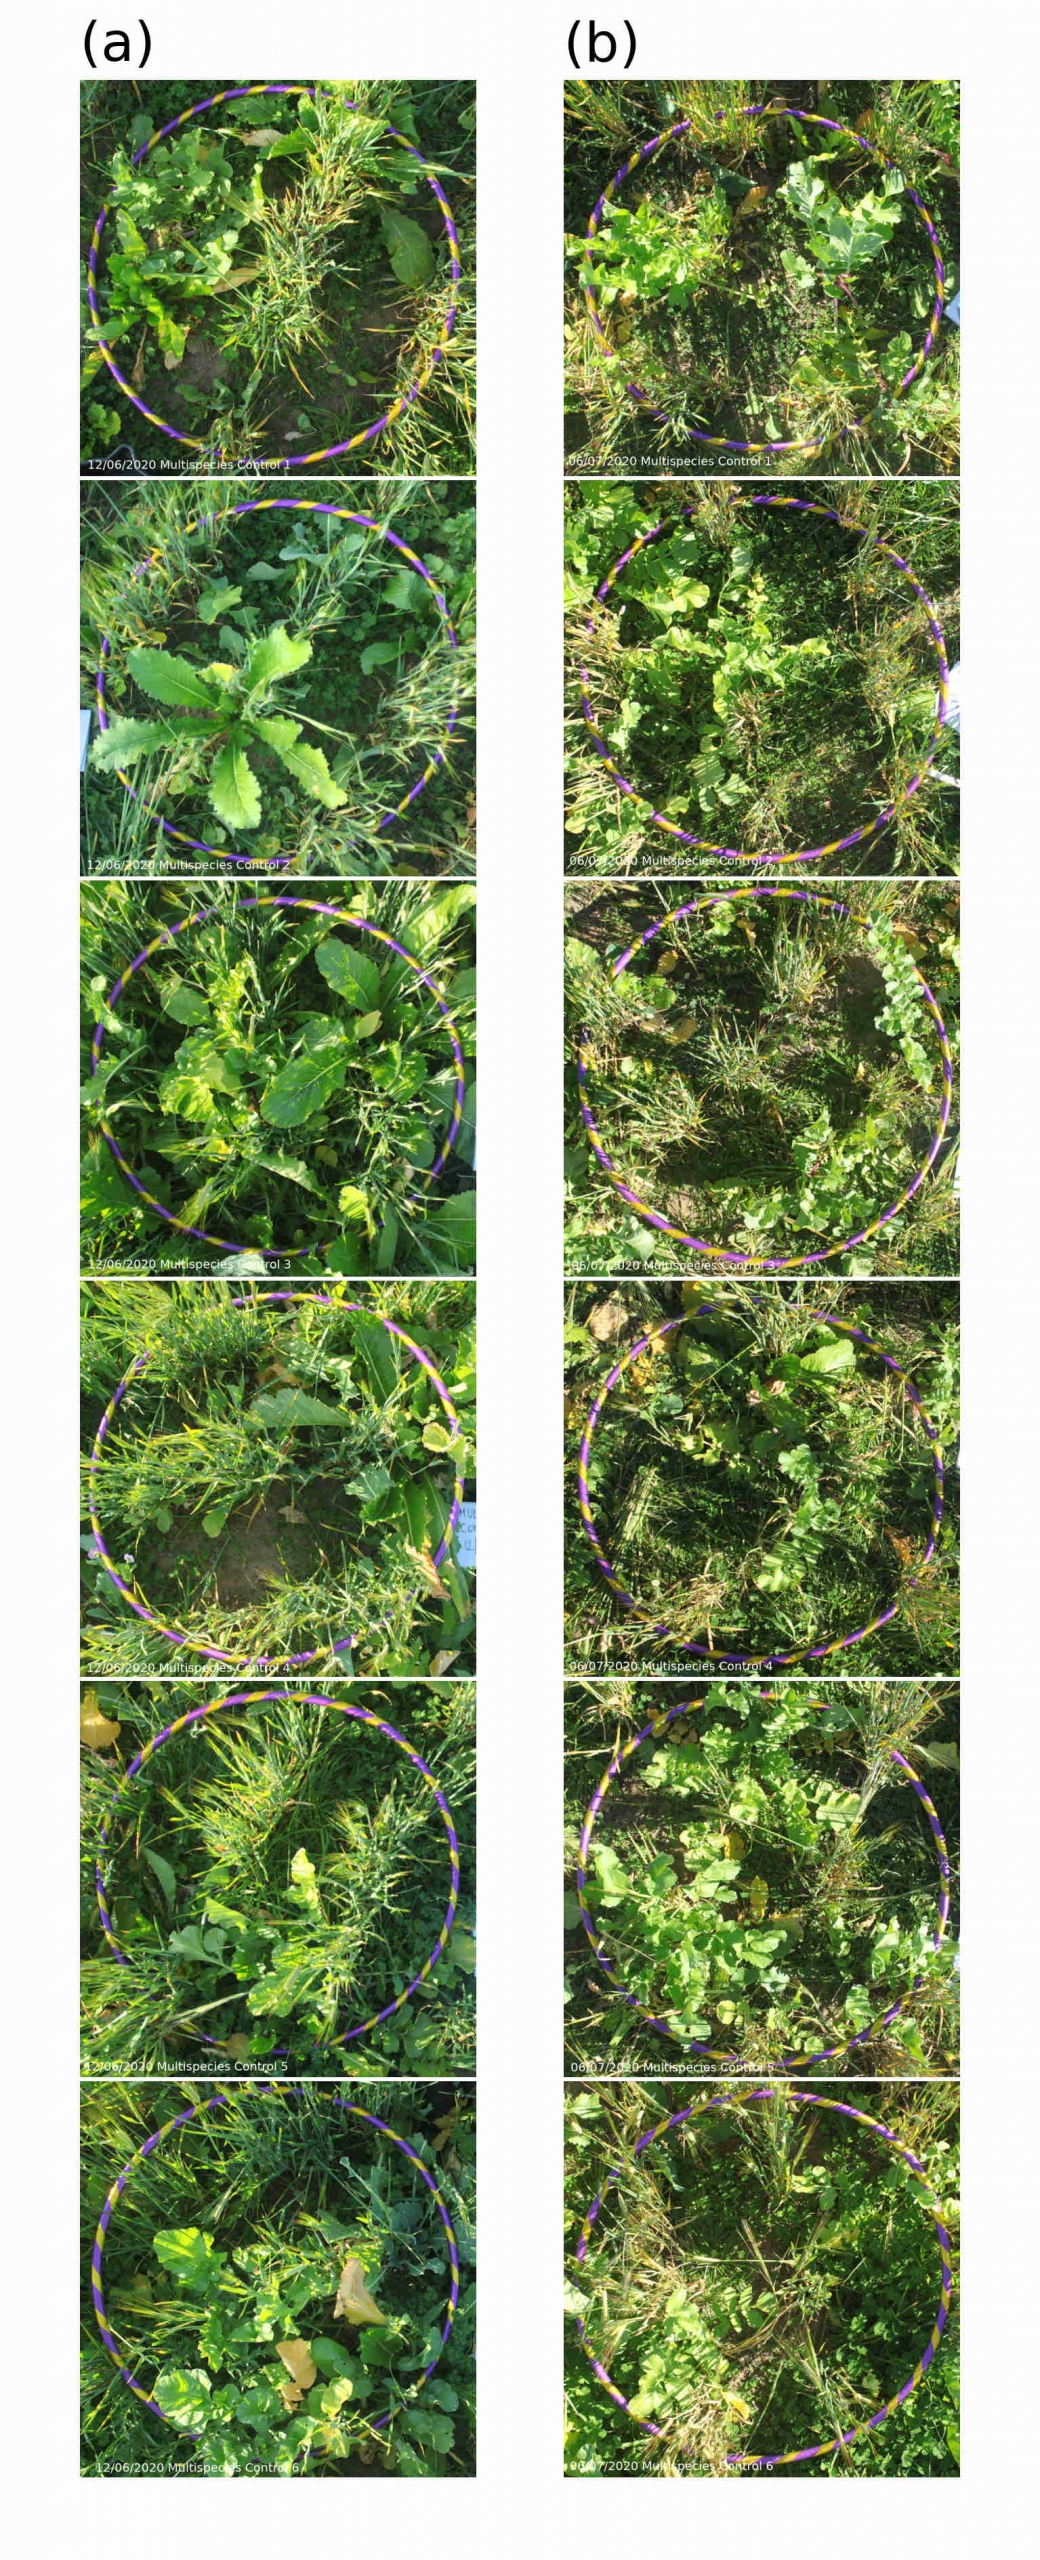
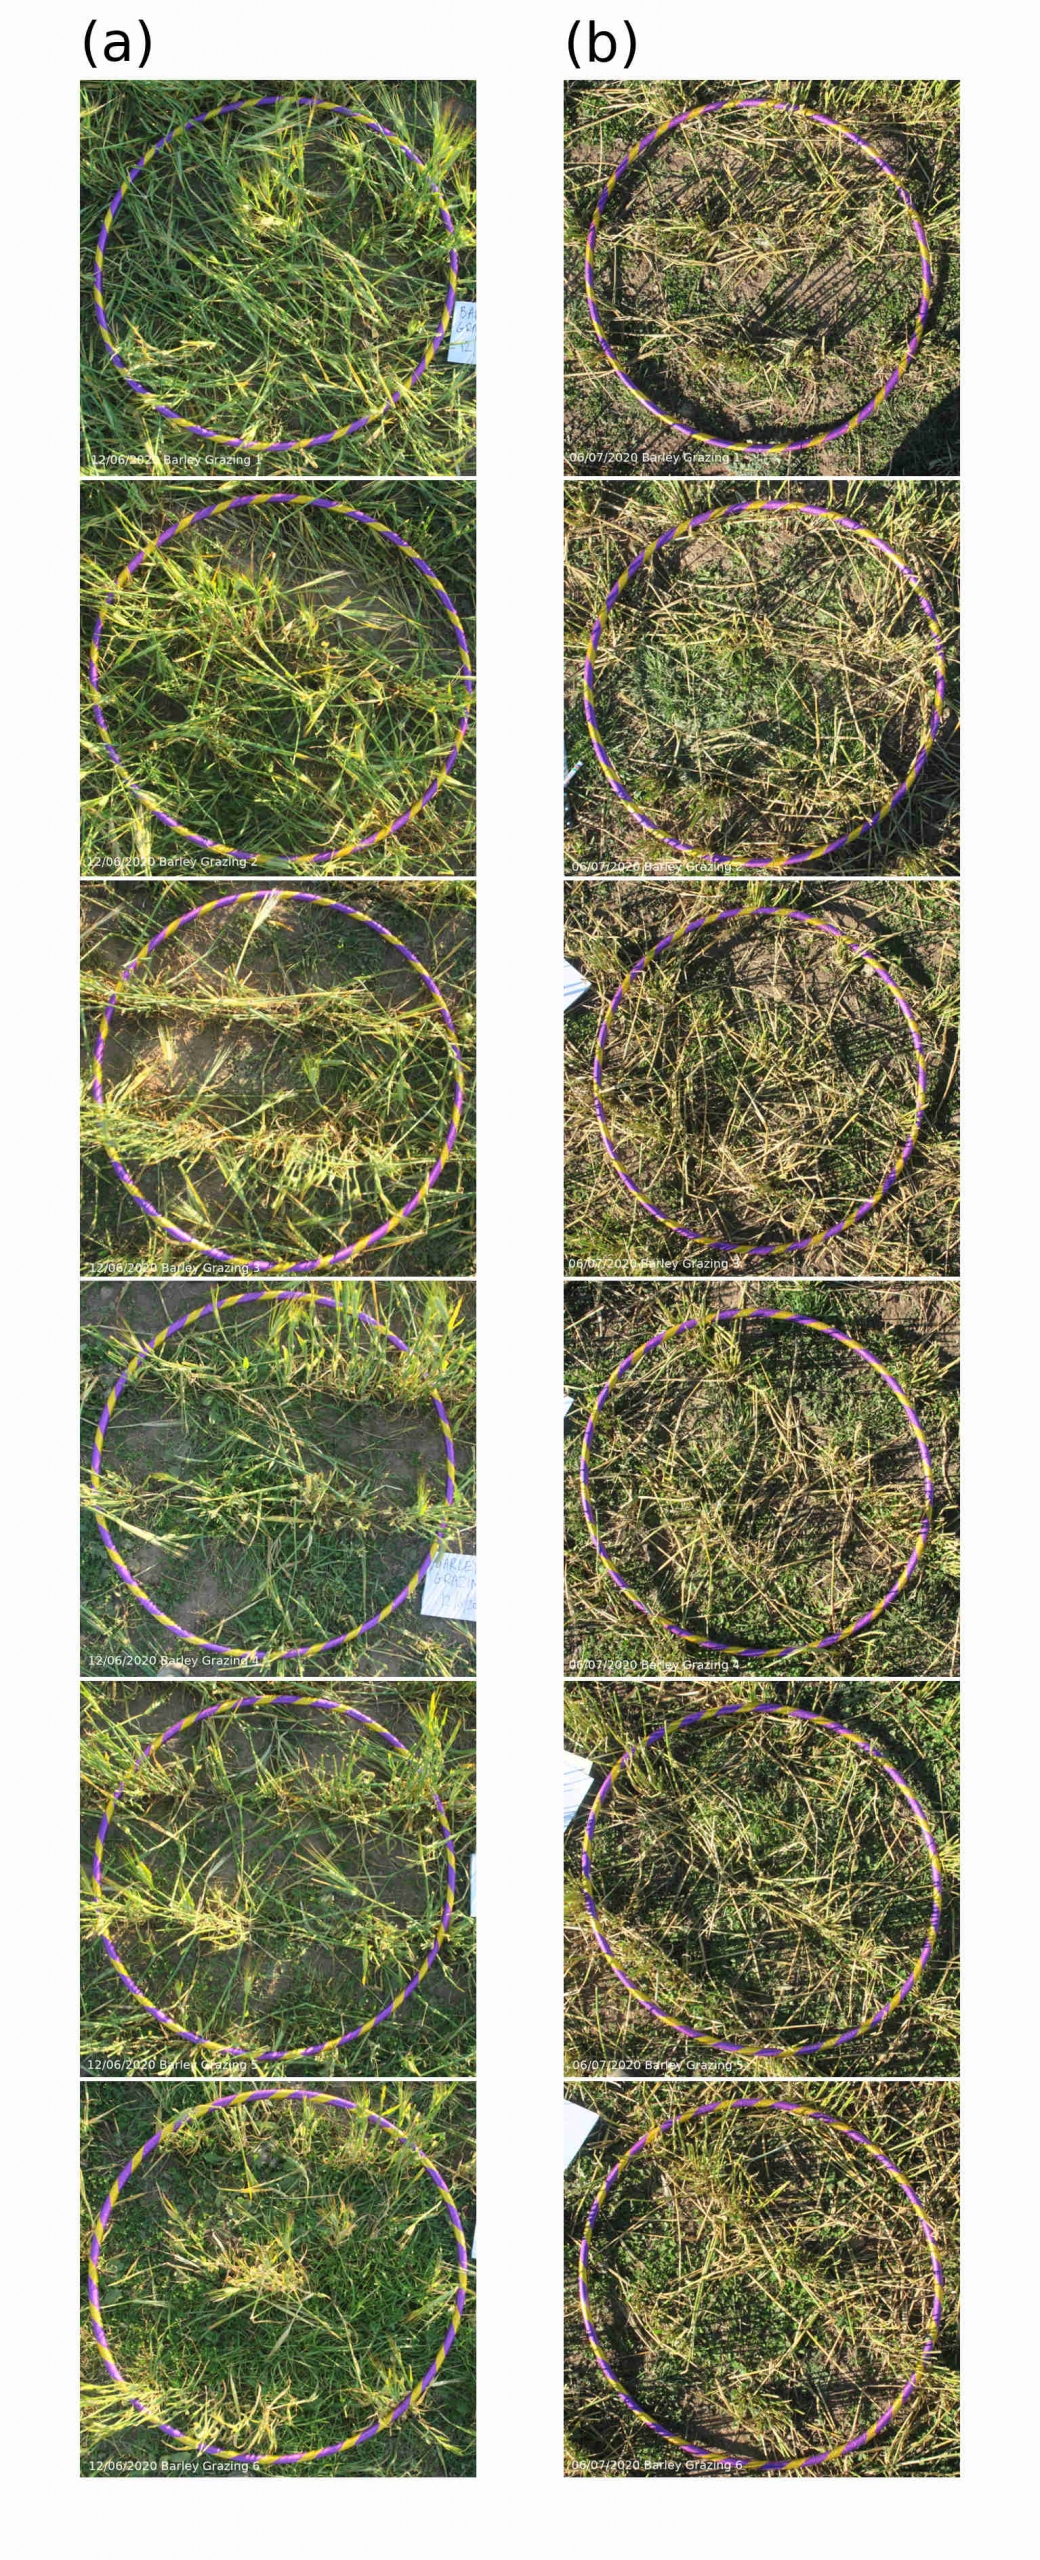
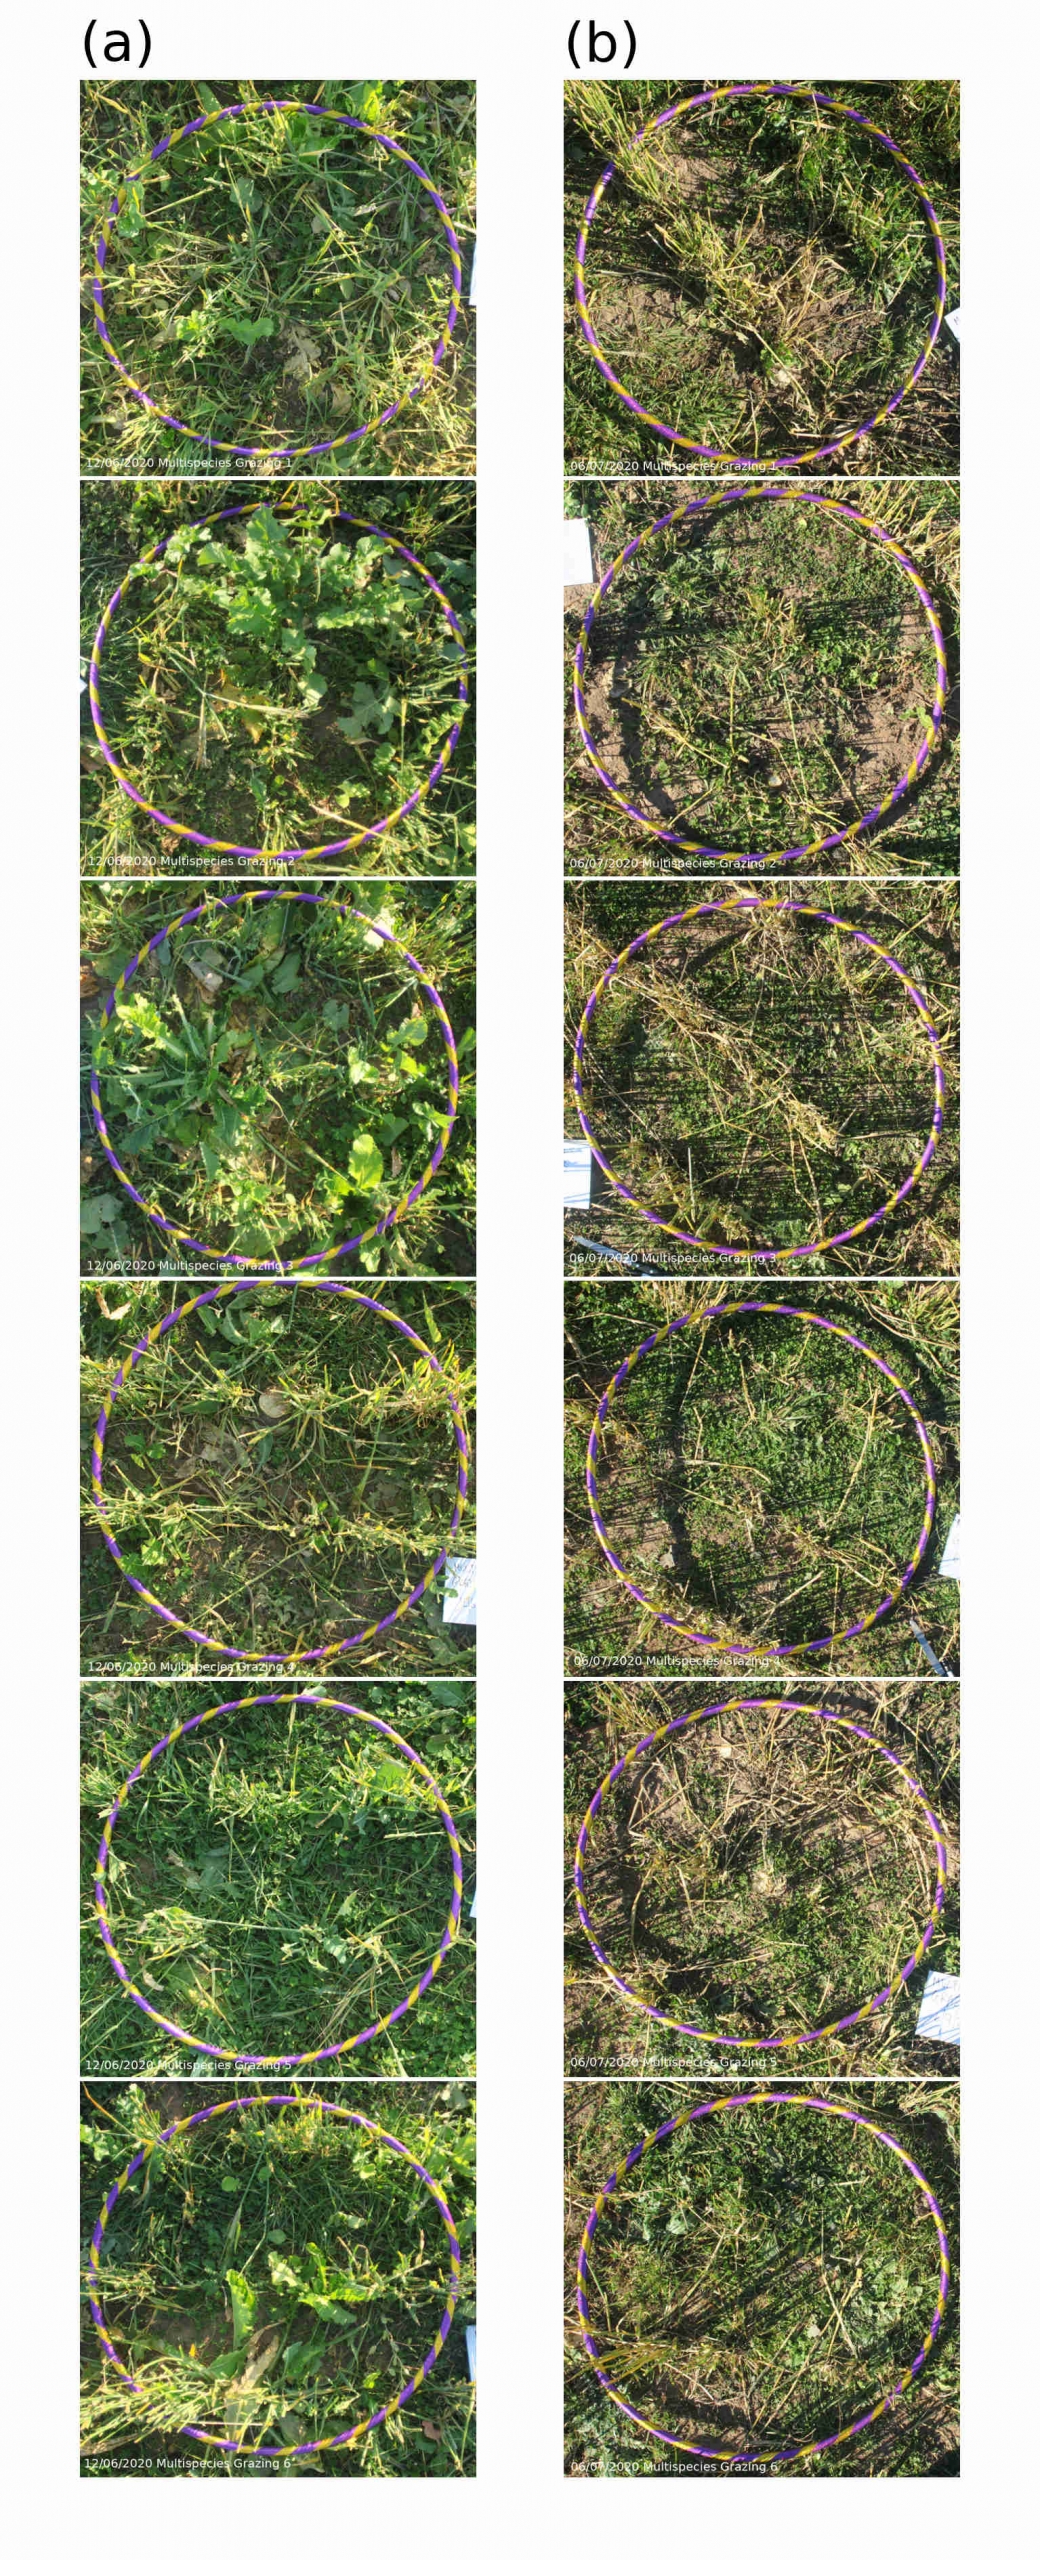
Biomass monitoring was conducted on 12 June (day 32 of grazing trial) and 6 July (day 55, end of grazing trial). 6 sub samples were collected from barley and multispecies grazing trial and control (adjacent un-grazed paddocks sown at the same time) plots by randomly throwing out a 0.5 m² quadrat. Each sub sample was photographed prior to biomass removal. Biomass was removed at ground level and samples were dried at 85°C to constant weight (±1 g).
Table 1: Mean ± Standard Deviation (N = 6) of multispecies and barley crop biomass from grazing trial and control plots.
Sample ID |
Sample date: 12/6/2020 |
Sample date: 6/7/2020 |
||||||
Fresh weight (g) |
Dry weight (g) |
% DM |
DM(kg/ha) |
Fresh weight (g) |
Dry weight (g) |
% DM |
DM(kg/ha) |
|
Barley Control |
458 (± 152) |
137 (± 51) |
30 (± 2) |
2601 (± 973) |
407 (± 48) |
124 (± 14) |
31 (± 0.3) |
2351 (± 268) |
Barley Grazing |
374 (± 59) |
124 (± 19) |
33 (± 2) |
2348 (± 351) |
178 (± 38) |
71 (± 13) |
40 (± 4) |
1351 (± 254) |
Multispecies Control |
1164 (± 390) |
208 (± 56) |
19 (± 4) |
3939 (± 1055) |
855 (± 184) |
164 (± 29) |
20 (± 4) |
3112 (± 540) |
Multispecies Grazing |
567 (±116) |
119 (± 18) |
21 (± 3) |
2250 (± 336) |
127 (± 60) |
41 (± 18) |
33 (± 5) |
780 (± 344) |

Figure 1: Barley control biomass sub-samples collected on (a) 12/06/2020 and (b) 06/07/2020.

Figure 3: Multispecies control biomass sub-samples collected on (a) 12/06/2020 and (b) 06/07/2020.

Figure 2: Barley grazing trial biomass sub-samples collected on (a) 12/06/2020 and (b) 06/07/2020.

