Animal Performance (weight gain)
.
Grazing
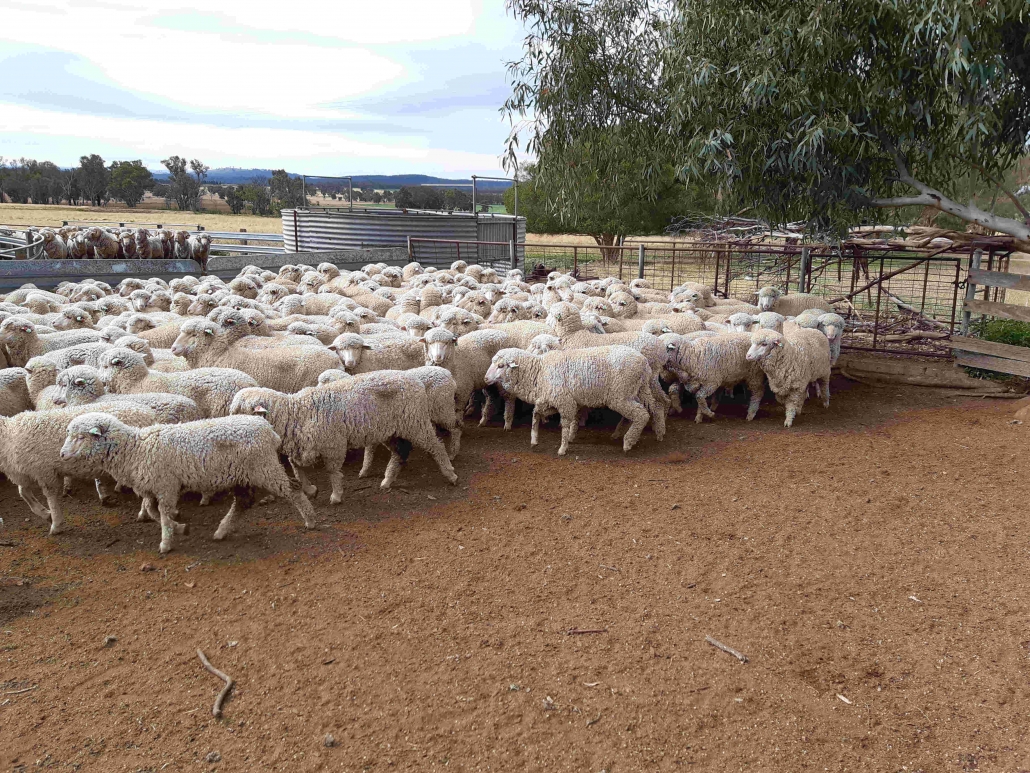
Due to a poor lambing season in 2019 as a result of drought, both autumn and spring drop lambs were included in the trial to provide sufficient numbers. As the autumn drop ewes and rams were reaching sexual maturity, management constraints necessitated splitting the lambs by sex for the two trial areas.
Barley trial area:
52 autumn ewe lambs @ 1 DSE and 175 spring ewe lambs @ 0.75 DSE – 28 DSE/ha
Multispecies trial area:
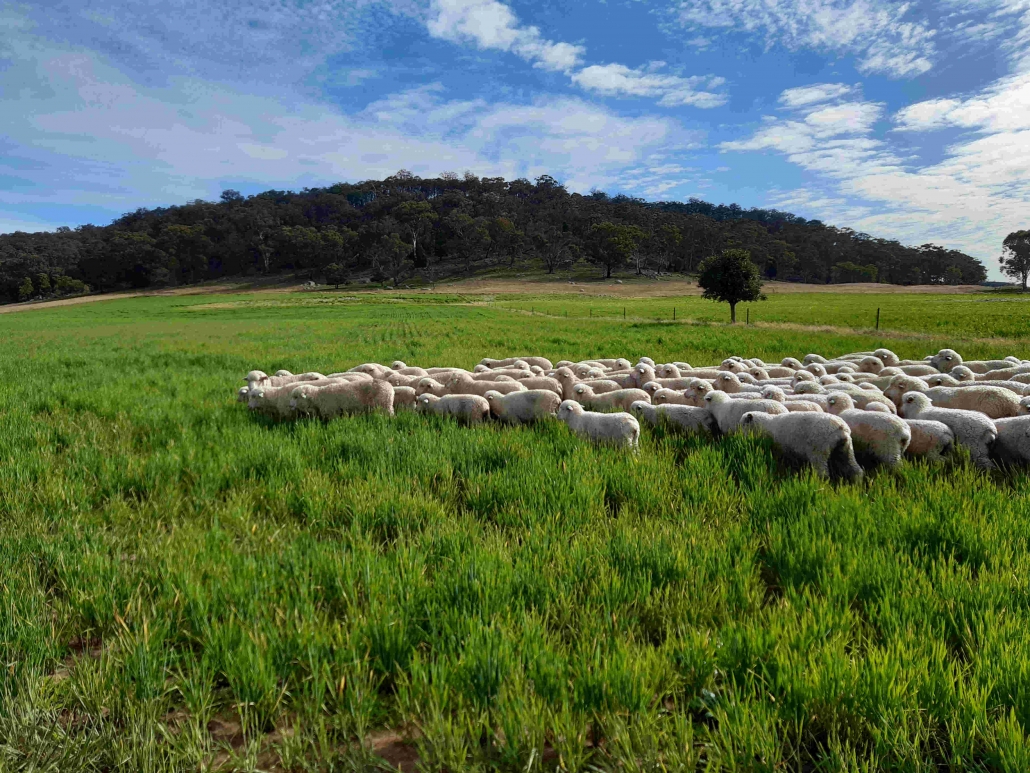
58 autumn ram lambs @ 1 DSE and 132 spring ram and wether lambs @ 0.75 DSE – 26 DSE/ha

Both crops were about 30 cm high, with all plants being well established when lambs were put in.
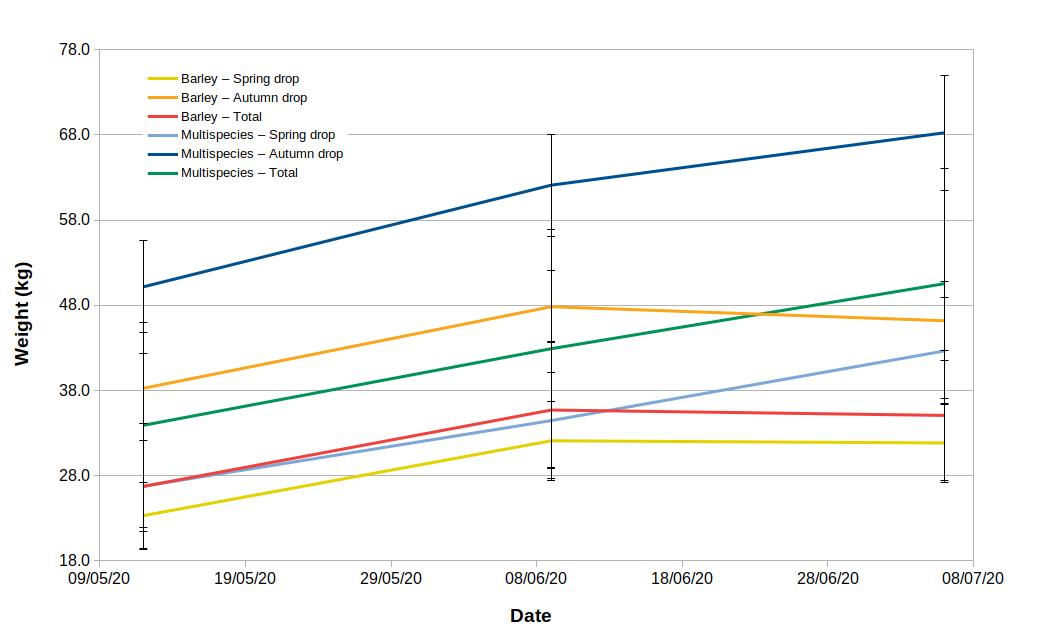
 Lambs were weighed at 0 days, ie. immediately before being put on the crops (12 May), at 28 days (9 June) and 55 days (6 July, end of trial).
The condition of lambs was qualitatively assessed by the landholder at each weighing. First weighing: both groups were equal. Second weighing: both groups were equal. Third weighing: There was a noticeable difference between mobs; the lambs from the barley paddock were not looking as healthy.
.
Table 1: Mean and Standard Deviation of lamb weights and weight gain of lambs grazing multispecies and barley trial plots, Winona.
Mob |
WEIGHT (kg) |
Total gain (kg) |
||||
12/05/20 |
09/06/20 |
06/07/20 |
15/5-9/6/2020
|
9/6-9/7/2020
|
12/5-6/7/2020
|
|
|
Barley – Spring drop |
23.3 (± 3.9) |
32.1 (± 4.7) |
31.8 (± 4.6) |
8.8 (± 1.8) |
-0.3 (± 2.0) |
8.5 (± 2.3) |
|
Barley – Autumn drop |
38.3 (± 4.1) |
47.8 (± 4.2) |
46.2 (± 4.7) |
9.6 (± 2.3) |
-1.7 (± 2.0) |
8.0 (± 2.2) |
|
Barley – Total |
26.7 (± 7.4) |
35.7 (± 8.0) |
35.1 (± 7.6) |
9.0 (± 2.0) |
-0.6 (± 2.0) |
8.4 (± 2.3) |
|
Multispecies – Spring drop |
26.8 (± 5.3) |
34.5 (± 5.6) |
42.6 (± 6.3) |
7.7 (± 2.4) |
8.1 (± 3.0) |
15.8 (± 3.6) |
|
Multispecies – Autumn drop |
50.2 (± 5.4) |
62.1 (± 6.0) |
68.3 (± 6.8) |
11.9 (± 2.7) |
6.1 (± 3.7) |
18.1 (± 4.0) |
|
Multispecies – Total |
33.9 (± 12.0) |
42.9 (± 14.0) |
50.5 (± 13.5) |
9.0 (± 3.2) |
7.5 (± 3.4) |
16.5 (± 3.9) |

Figure 1: Mean weights of lamb mobs grazing multispecies and barley trial plots, Winona.
.
Table 2: Average daily weight increase of lambs grazing multispecies and barley trial plots, Winona.
Mob |
Weight gain g/d |
||
15/5-9/6/2020
|
9/6-9/7/2020
|
12/5-6/7/2020
|
|
|
Barley – Spring drop |
313.8 (± 65.3) |
-9.6 (± 72.7) |
155.0 (± 40.9) |
|
Barley – Autumn drop |
342.0 (± 81.2) |
-62.8 (± 72.8) |
144.7 (± 40.6) |
|
Barley – Total |
320.2 (± 70.1) |
-21.6 (± 75.9) |
152.7 (± 41.0) |
|
Multispecies – Spring drop |
274.9 (± 85.4) |
299.3 (± 111.8) |
287.0 (± 66.3) |
|
Multispecies – Autumn drop |
426.1 (± 95.3) |
227.7 (± 136.6) |
328.7 (± 72.0) |
|
Multispecies – Total |
321.1 (± 112.5) |
277.2 (± 124.1) |
299.9 (± 70.6) |

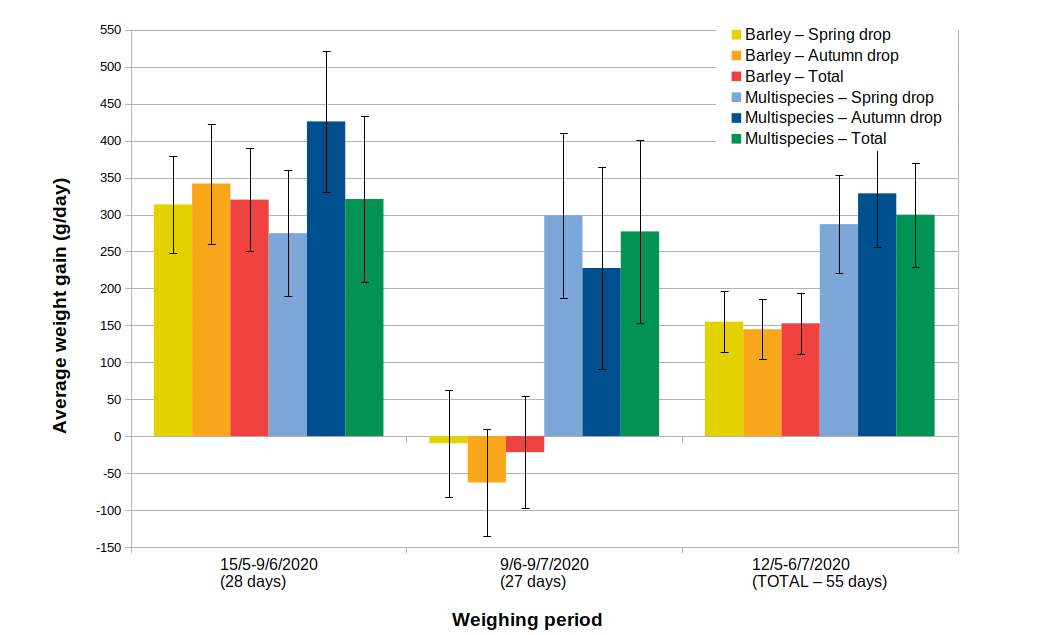
Figure 2: Average daily weight increase of lambs grazing multispecies and barley trial plots, Winona.
The overall daily weight gain was significantly greater for lambs in multispecies pastures (P < 0.05) compared to barley (Figure 3). Autumn born lambs grew faster than spring born lambs if grazing in multispecies pastures (P < 0.05) but not different if grazing barley.

Figure 3: Daily weight gain of spring and autumn lambs grazing multispecies and barley grazing trial plots, a-c denote treatments which are statistically different.
Live weight at the start and end of the trial was greater in multispecies and autumn born lambs (P < 0.05) however the difference in live weight between the start and end of the trial was greater in multispecies (Figure 4).

